

ตรวจสุขภาพใจ
เครื่องมือประเมินสุขภาพจิตเบื้องต้น และคัดกรองความเสี่ยงต่อปัญหาสุขภาพจิตจากสถานการณ์ COVID-19


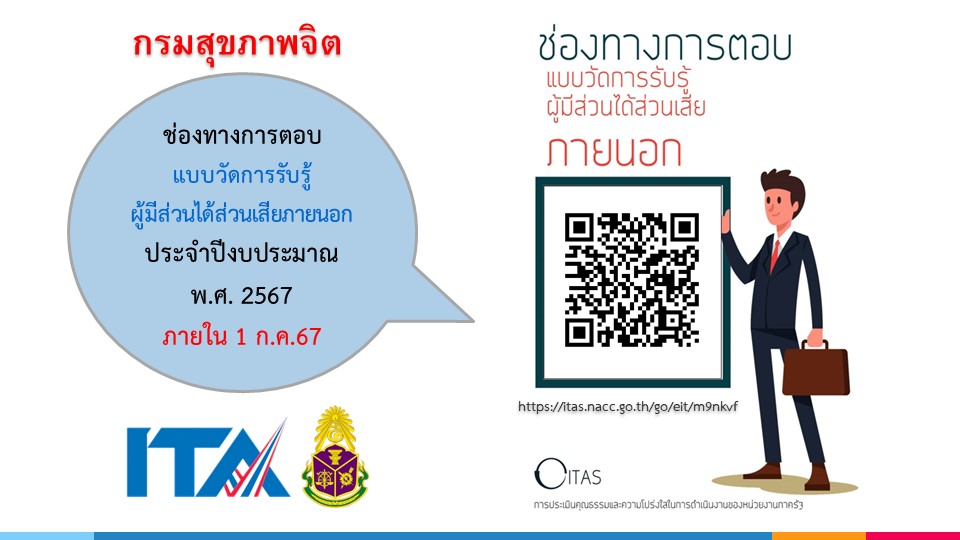
ITA
การประเมินคุณธรรมและความโปร่งใสในการดำเนินงานของหน่วยงานภาครัฐ (Integrity and Transparency Assessment: ITA)
พิธีมอบรางวัลเลิศรัฐ ประจำปี 2566
กรมสุขภาพจิตได้รับรางวัลฯ รวมทั้งสิ้นจำนวน 6 รางวัล 5 ผลงาน จาก 5 หน่วยงาน
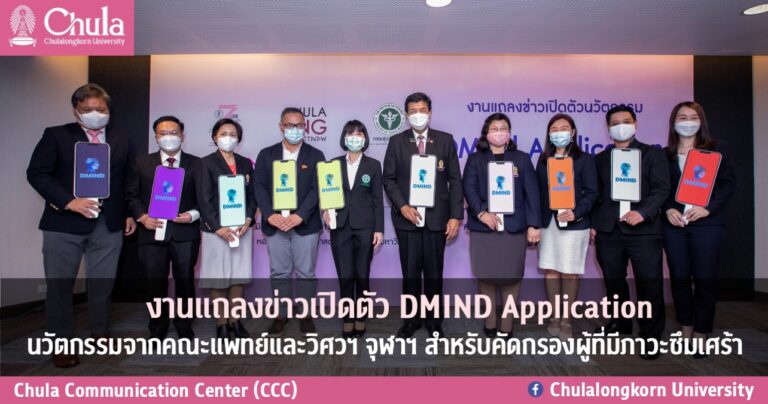
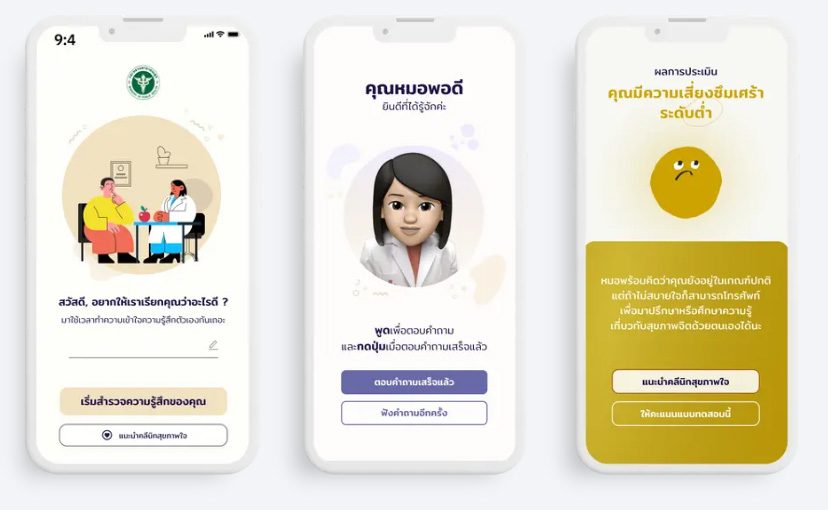
DMIND “AI คัดกรองภาวะซึมเศร้า”
DMIND เป็นแอปพลิเคชันสำหรับคัดกรองผู้ที่มีภาวะซึมเศร้า ช่วยให้ประชาชนประเมินความเสี่ยงของภาวะซึมเศร้าจากลักษณะการแสดงออกทางหน้าตา น้ำเสียง และข้อความ สามารถประเมินภาวะซึมเศร้าเบื้องต้นได้อัตโนมัติ มีความถูกต้อง แม่นยำ ช่วยลดขั้นตอนในการวินิจฉัยของแพทย์
เปิดตัว DMIND Application
งานแถลงข่าว
สาธิตการใช้งาน
Application
Application ปัญญาประดิษฐ์ (AI) ที่ถูกออกแบบ มาเป็นเพื่อนที่พร้อมรับฟัง ทุกความรู้สึกของคุณ และเช็คโรคซึมเศร้า
Services
ผู้บริหารระดับสูงกรมสุขภาพจิต

นพ. พงศ์เกษม ไข่มุกด์
อธิบดีกรมสุขภาพจิต
นพ. จุมภฎ พรมสีดา
รองอธิบดีกรมสุขภาพจิต
นพ. ศิริศักดิ์ ธิติดิลกรัตน์
รองอธิบดีกรมสุขภาพจิต
นพ. ธิติ แสวงธรรม
รองอธิบดีกรมสุขภาพจิตข่าวประชาสัมพันธ์

เอกสาร ยุทธศาสตร์ กรมสุขภาพจิต
Click Here »เอกสาร นโยบายกรมสุขภาพจิต
Click Here »เอกสาร คำรับรองการปฏิบัติราชการกรมสุขภาพจิต
Click Here »โครงสร้าง โครงสร้างหน่วยงาน กรมสุขภาพจิต
Click Here »Application กรมสุขภาพจิต
Line, iOS, Android Application จากกรมสุขภาพจิต ในการประเมินสุขภาพจิต ข้อมูลข่าวสาร อื่นๆ เลือก Download ได้เลยค่ะ .
Click Here